Leaky-Mode Metasurface Makes Holograms with a Halogen Lamp
Until now, metasurface holograms needed a laser. Researchers at the University of Toronto produced them with a halogen lamp. A Q-200 resonance compresses a 300-nanometer band to under 4 nanometers, so the device generates coherence itself. That flips the strengths and weaknesses of laser holograms: speckle averages itself out and shrinks, while thin strokes blur.
DOI 10.1002/lpor.72007If you had to name one reason holographic displays have not become products, it would be the light source. Building an image through interference requires coherence, and the light source that provides coherence is the laser.
But a laser brings three things with it. Speckle mottles the screen, safety standards apply because the light enters the eye, and using three separate RGB wavelengths complicates the optics accordingly.
What this paper touched is that premise. It produced a hologram with a single halogen lamp.
One distinction is worth making. Metasurface holograms so far have been devices that take coherence a laser has already provided and only reshape the light. In the paper’s words, the coherence of the source was not a function of the device but a precondition for its operation.
The University of Toronto researchers moved that precondition inside the device. A resonance with a quality factor of 200 compresses halogen light 300 nanometers wide to under 4 nanometers, and coherence arises from that compression.
And precisely because of that, the strengths and weaknesses of laser holograms are reversed. Speckle, the laser’s headache, shrinks, while the spatial coherence a laser takes for granted runs short and thin strokes blur.
1. Why metasurface holograms needed a laser
Because the resonance linewidth is broad, so when many wavelengths come in at once the images overlap. Conventional metasurfaces use local resonances that confine light in each individual structure, with quality factors on the order of 10–50.
All-dielectric metasurfaces have high diffraction efficiency because they avoid metal absorption losses, but their Mie resonance linewidth is 30–50 nanometers. Feeding them broadband light produces correspondingly large chromatic aberration.
Metal is worse. Surface plasmon structures have quality factors of 5–10, which is why plasmonic structural color has a gamut stuck at about 45% of sRGB. Resistive losses broaden the resonance.
There are precedents for placing metasurfaces on waveguides. But those devices also fed the waveguide with an already coherent laser — a 1.55-micrometer diode laser through a lensed fiber, or a visible laser line.
So the empty slot is clear. There were only devices that use coherence, not devices that create it.
2. What does it mean for a device to create coherence?
It means passing only the combinations where wavelength and angle match simultaneously, carving narrow light out of broad light. The core structure is a prism-coupled multilayer metal-clad leaky waveguide (MMCLW).
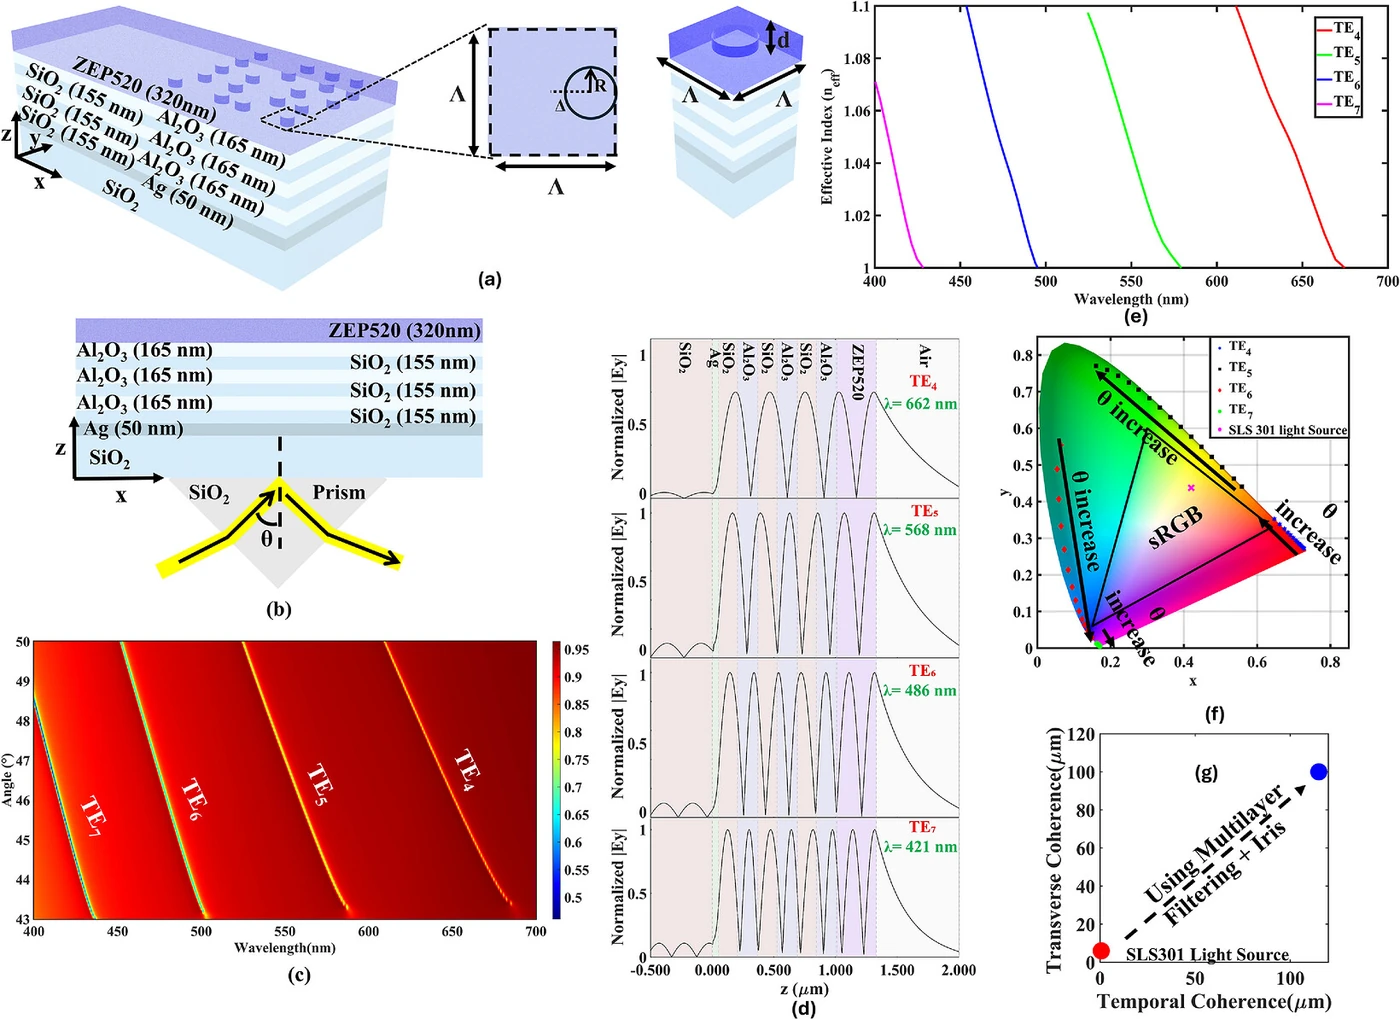
The stack is as follows. On a fused silica substrate sit 2 nanometers of chromium and 50 nanometers of silver, topped by three pairs of alternating 155-nanometer silicon dioxide and 165-nanometer aluminum oxide, and finally a 320-nanometer layer of ZEP520 electron-beam resist.
This structure supports a leaky guided mode with a quality factor of 200. It suppresses resistive loss by reducing the overlap of the electromagnetic field with the metal; compared with the 5–10 of surface plasmon structures, that is twenty to forty times higher.
It is not only the wavelength that is narrow. The resonance’s angular width is 0.27°. Light enters only through a very narrow solid angle around the phase-matching condition.
Filtered twice, by wavelength and by angle, the result is this: the halogen source’s width of about 300 nanometers is compressed into a channel with a measured linewidth of 3.7 nanometers or less, temporal coherence rises by two orders of magnitude, and the coherence length becomes about 115 micrometers.
The spatial side is solved with geometry. Placing a 0.5-millimeter aperture at the focal plane in front of the collimator matches the source’s effective angular width to the device’s acceptance angle, giving a spatial coherence diameter of about 100 micrometers at the metasurface plane — 17 times that without the aperture.
3. Splitting channels three ways: wavelength, angle, polarization
There are three ways to pull multiple channels out of a single device, each using a different degree of freedom.
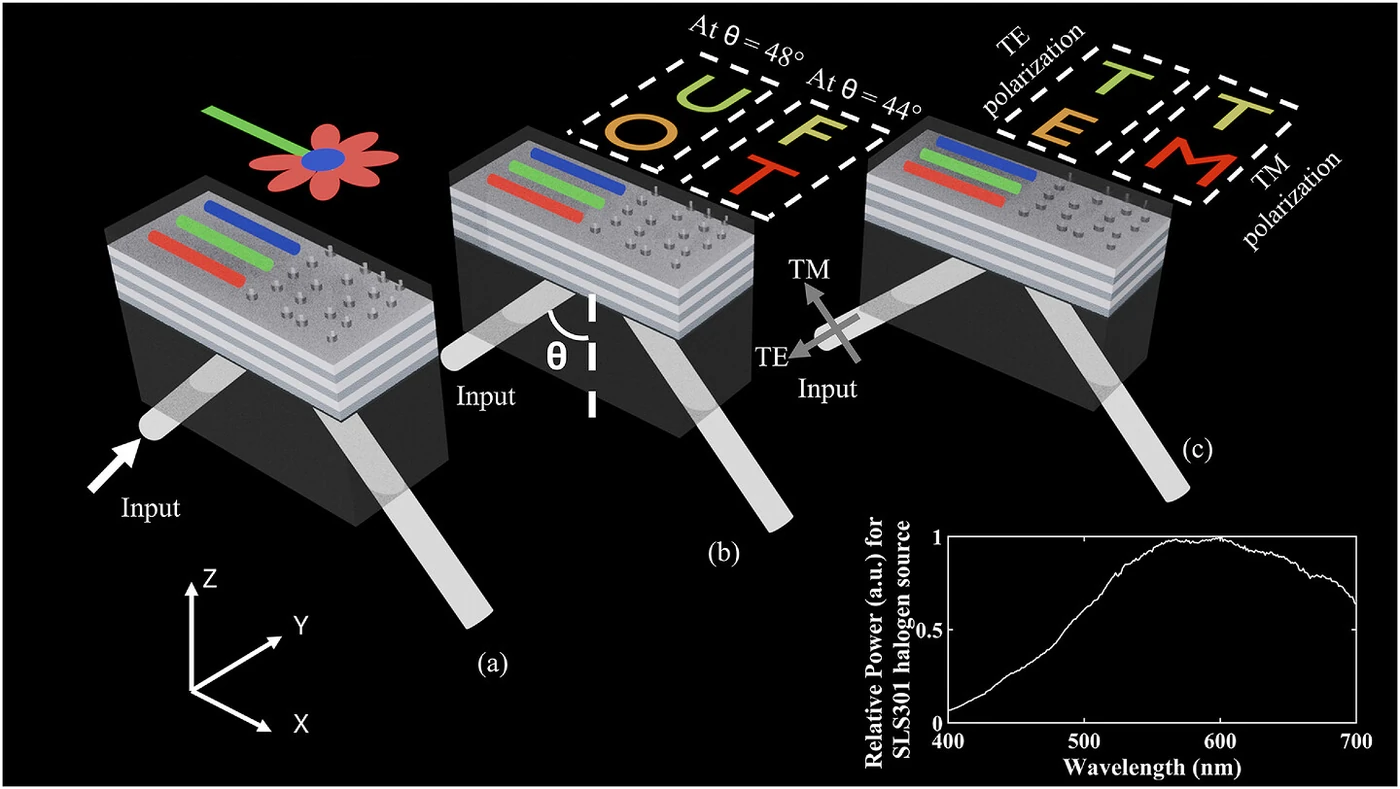
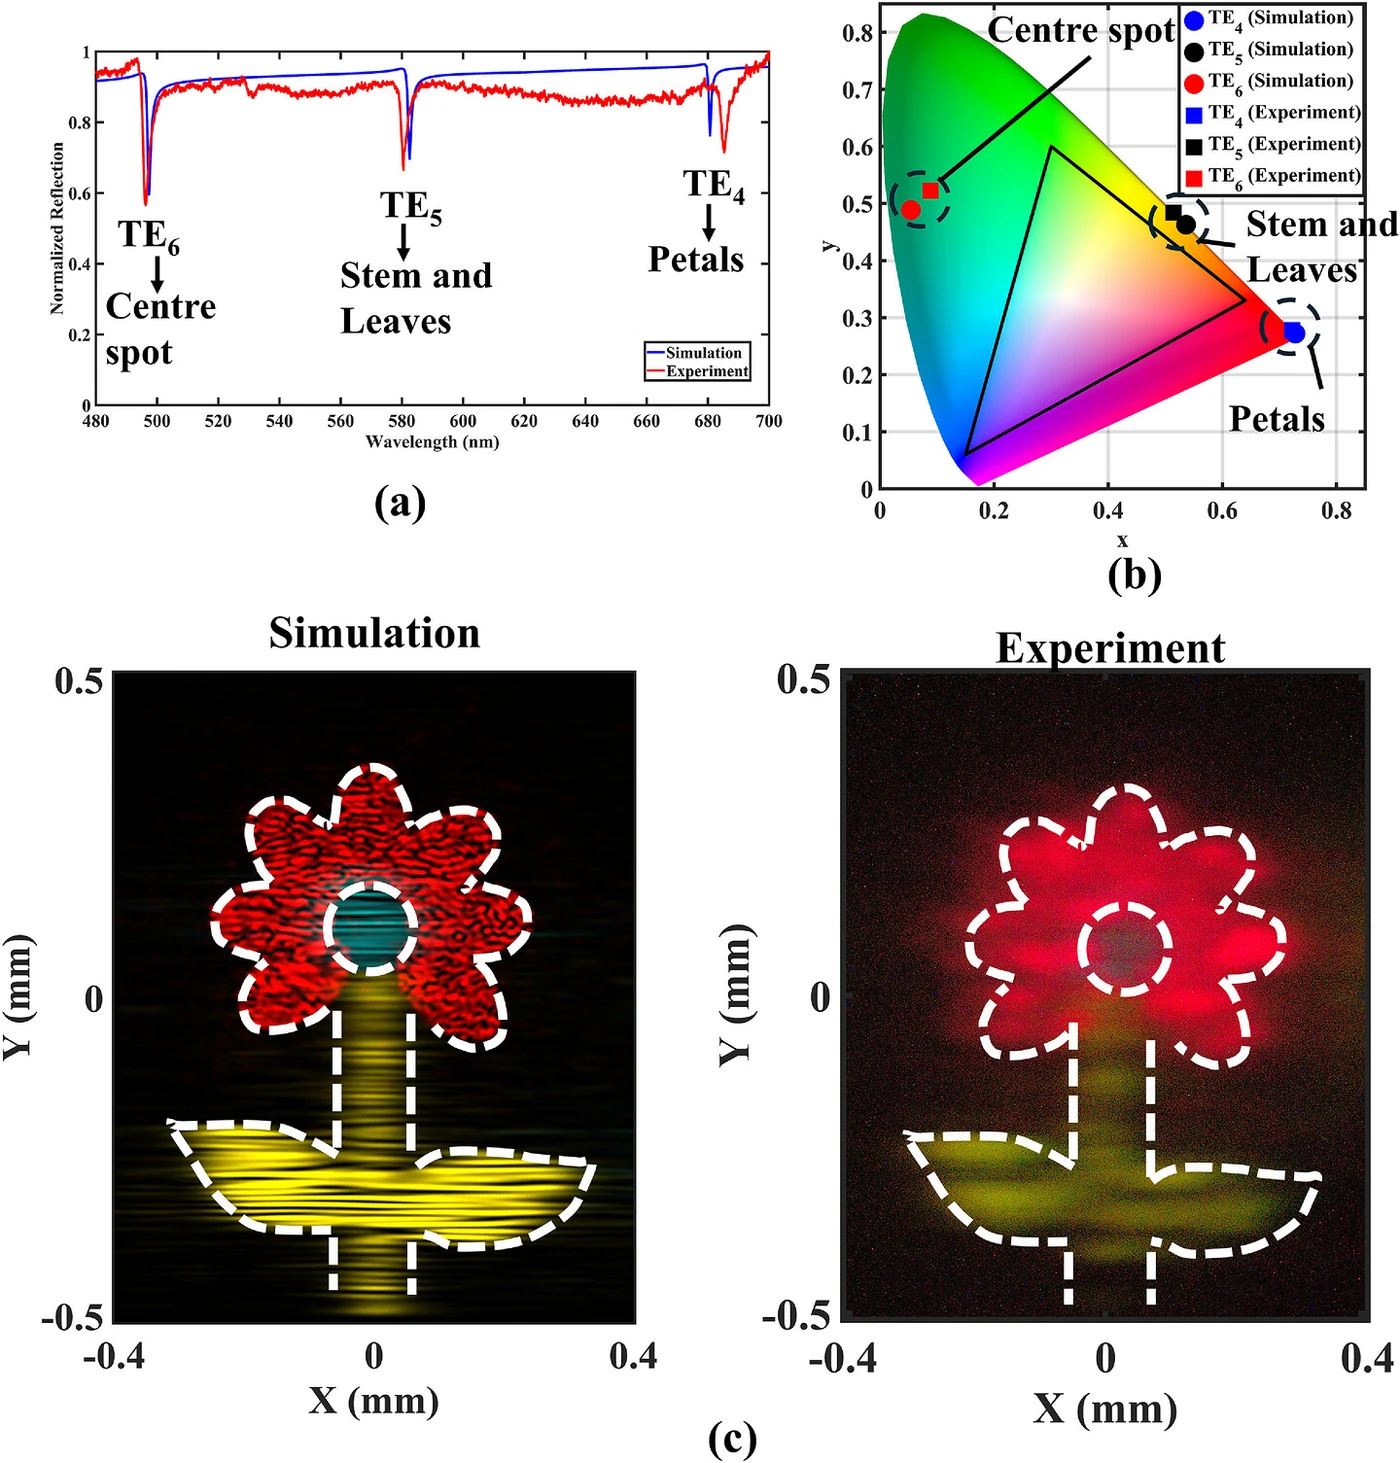
Split by wavelength. Fixing the incidence angle at 43.5° brings three resonances into the visible: TE6 at 497.3 nanometers (cyan), TE5 at 582.6 nanometers (yellow-green), and TE4 at 680.8 nanometers (red). A flower image was divided among these three, projecting red petals, a yellow-green stem and leaves, and a cyan center. Measured linewidths were 2.6–2.9 nanometers, with a mean absolute wavelength deviation of 2.6 nanometers.
Earlier multicolor metasurface holograms did this by feeding in separate RGB lasers. The point of this section is that the same full-color reconstruction was achieved with a single broadband thermal source.
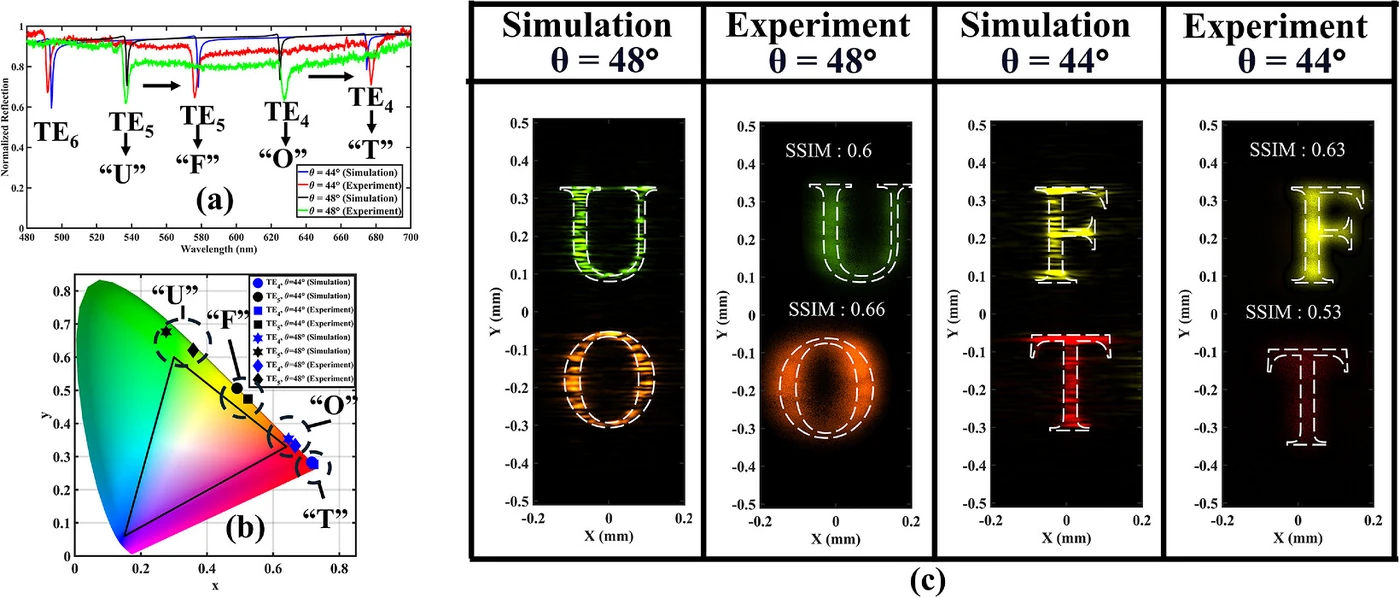
Split by angle. At a 48° incidence angle, TE5 projects a green “U” and TE4 an orange “O”; switch to 44°, and TE5 projects a yellow “F” and TE4 a crimson “T.” With an angular dispersion slope of −10 to −12 nanometers/degree, a 4° difference produces a wavelength shift of more than 40 nanometers — far enough relative to the roughly 3-nanometer linewidth that interference between angular channels is suppressed on its own.
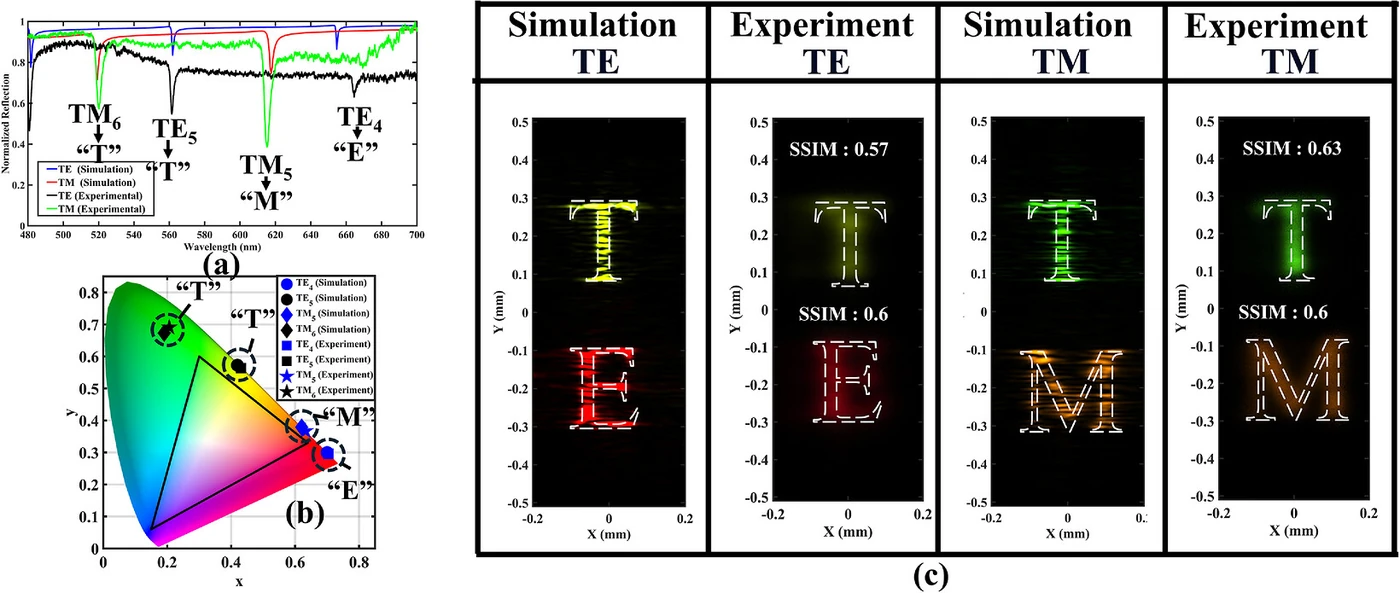
Split by polarization. At a 45.7° incidence angle, this structure supports both TE and TM leaky modes across 480–700 nanometers. With TE input, TE5 projects a yellow-green “T” and TE4 a red “E”; switch to TM, and TM6 projects a green “T” and TM5 an orange “M.” There was no noticeable leakage between channels.
4. From the display side, the color gamut is what catches the eye
With linewidths under 4 nanometers, the colors are extremely saturated, and their coordinates fall outside the sRGB triangle. The measured coordinates of each mode lie near the CIE 1931 spectral locus.
This number means something because there is a basis for comparison. By the reference values the same paper records, plasmonic structural color covers about 45% of sRGB, and typical silicon metasurfaces about 78%. That is where resistive loss and broad resonances have eroded saturation.
The tuning method also draws display-side interest. Since the angular dispersion is −10 to −12 nanometers/degree, simply rotating the incidence angle can move the wavelength continuously along the spectral locus. The knob that makes color is geometry, not material.
This is where the word “nonlocal” takes on substance. The leaky guided mode spreads and decays along the grating over 15–35 micrometers (45–102 unit cells). Color is set not by a single structure but by many grating periods together.
5. Between the abstract and the body
The abstract states improved coherence and a gamut breakthrough. Read the body, and four conditions attach.
First, efficiency is not in the abstract. Outcoupling efficiency into the −1st diffraction order is 0.6–1.3% across the four TE modes. The body notes that enlarging the nanohole radius and etch depth raises this efficiency but at the cost of a lower quality factor. That a hologram appeared and that a bright screen can be built are different stories.
Second, spatial coherence is smaller than the device aperture. At 100 micrometers, the coherence diameter is smaller than the device size, so it acts like a low-pass filter. The measured images therefore have softer edges and lower contrast than the simulations, with structural similarity stuck at 0.53–0.66. The lowest, the crimson “T,” lost more of its thin strokes because it was captured at the same exposure as the bright yellow “F.”
The authors put these values in context. A prior study that used an LED with a 75-micrometer pinhole, a 10-nanometer spectral filter, and even camera-feedback correction reached 0.65, and an LED without a pinhole reached 0.57. The paper’s claim is that it landed in that range with a raw halogen source, not that its absolute image quality is good.
Third, the reduced speckle is, turned over, the result of insufficient coherence. Speckle remains in the simulated images, but in the experiment the broadband thermal source averages mutually offset speckle patterns, suppressing them by 1/√N. The weakness of laser holograms becomes an advantage here, but the two are faces of the same cause. The periodic banding visible in the images is not a fabrication defect but comes from the discrete pixel structure of the design algorithm.
Fourth, it is not “all you need is a lamp.” The source is a halogen lamp with a color temperature of about 3,400K, but a collimator and a 0.5-millimeter aperture stand in front of it, and the light is prism-coupled to enter at a specific angle. The laser was removed, but angular alignment came in. Because the device uses a resonance with a 0.27° angular width, the alignment tolerance is correspondingly tight.
The color gamut needs a condition too. What was exceeded here is the color coordinates of the light leaving the device, not the gamut of a screen. A screen’s gamut is set only after pixels are made with that light and brightness and white point are established. The 0.6–1.3% efficiency noted above is exactly the number that sits in between.
6. What’s left for industry
This device will not become a display now. Efficiency is under 1%, the image forms on a screen 5 millimeters away, and it is a static metasurface with 1000×1000 pixels each 340 nanometers in size, so changing the content means fabricating it again.
Still, DISPLAY NOW runs this paper because there are two things that can be carried over.
One is the design axis. Rather than building a better light source and feeding it into the device, you feed in an ordinary source and let the device carve out only the coherence it needs. The same question can be asked wherever laser sources run into speckle, safety, or cost.
The other is the knob that makes color. The reason structural-color metasurfaces were stuck at 45–78% of sRGB was resonance linewidth, and narrowing that linewidth below 4 nanometers with nonlocal leaky modes pushes saturation out to the spectral locus. That is a number that bears directly on reflective and structural color.
The remaining question is clear. Efficiency and quality factor sit at opposite ends of the same knob. Enlarge the nanoholes and it gets brighter and the resonance broadens; shrink them and the color purifies and it dims. Whether there is a usable spot on this trade-off curve is something this paper did not answer.