
An isosorbide crosslinker holds both transparency and recovery in a foldable adhesive
The quietest layer in a foldable screen is the optically clear adhesive. Fold it and a mark stays; stretch it and it goes hazy. A UNIST and Youngwoo team rebuilt the crosslinker from isosorbide, derived from corn, holding 98.6% transmittance even stretched 50% and returning to place in 2.5 seconds when released. The paper calculates that this transmittance difference alone extends battery life by about 4%.
DOI 10.1002/advs.77348Take a foldable screen apart and cover window, polarizer, touch sensor and panel are stacked layer on layer, with optically clear adhesive (OCA) between each. Tens of micrometres thick, with almost no presence. And yet this layer has to do two contradictory things at once.
It has to stay stuck, and at the same time it has to move. Fold it and the outer face stretches while the inner face is compressed. If the layers cannot slide against each other, stress piles into the stiff layers and they crack; if they slide too much, they delaminate. On top of that this layer sits in the path of the light, so the slightest haze darkens the whole screen by that much.
The acrylic adhesives in use today do not satisfy both at once. This paper, from the Department of Energy and Chemical Engineering at UNIST together with the adhesive film converter Youngwoo Co., went at that point by synthesizing an entirely new crosslinker.
1. A molecule that came from corn
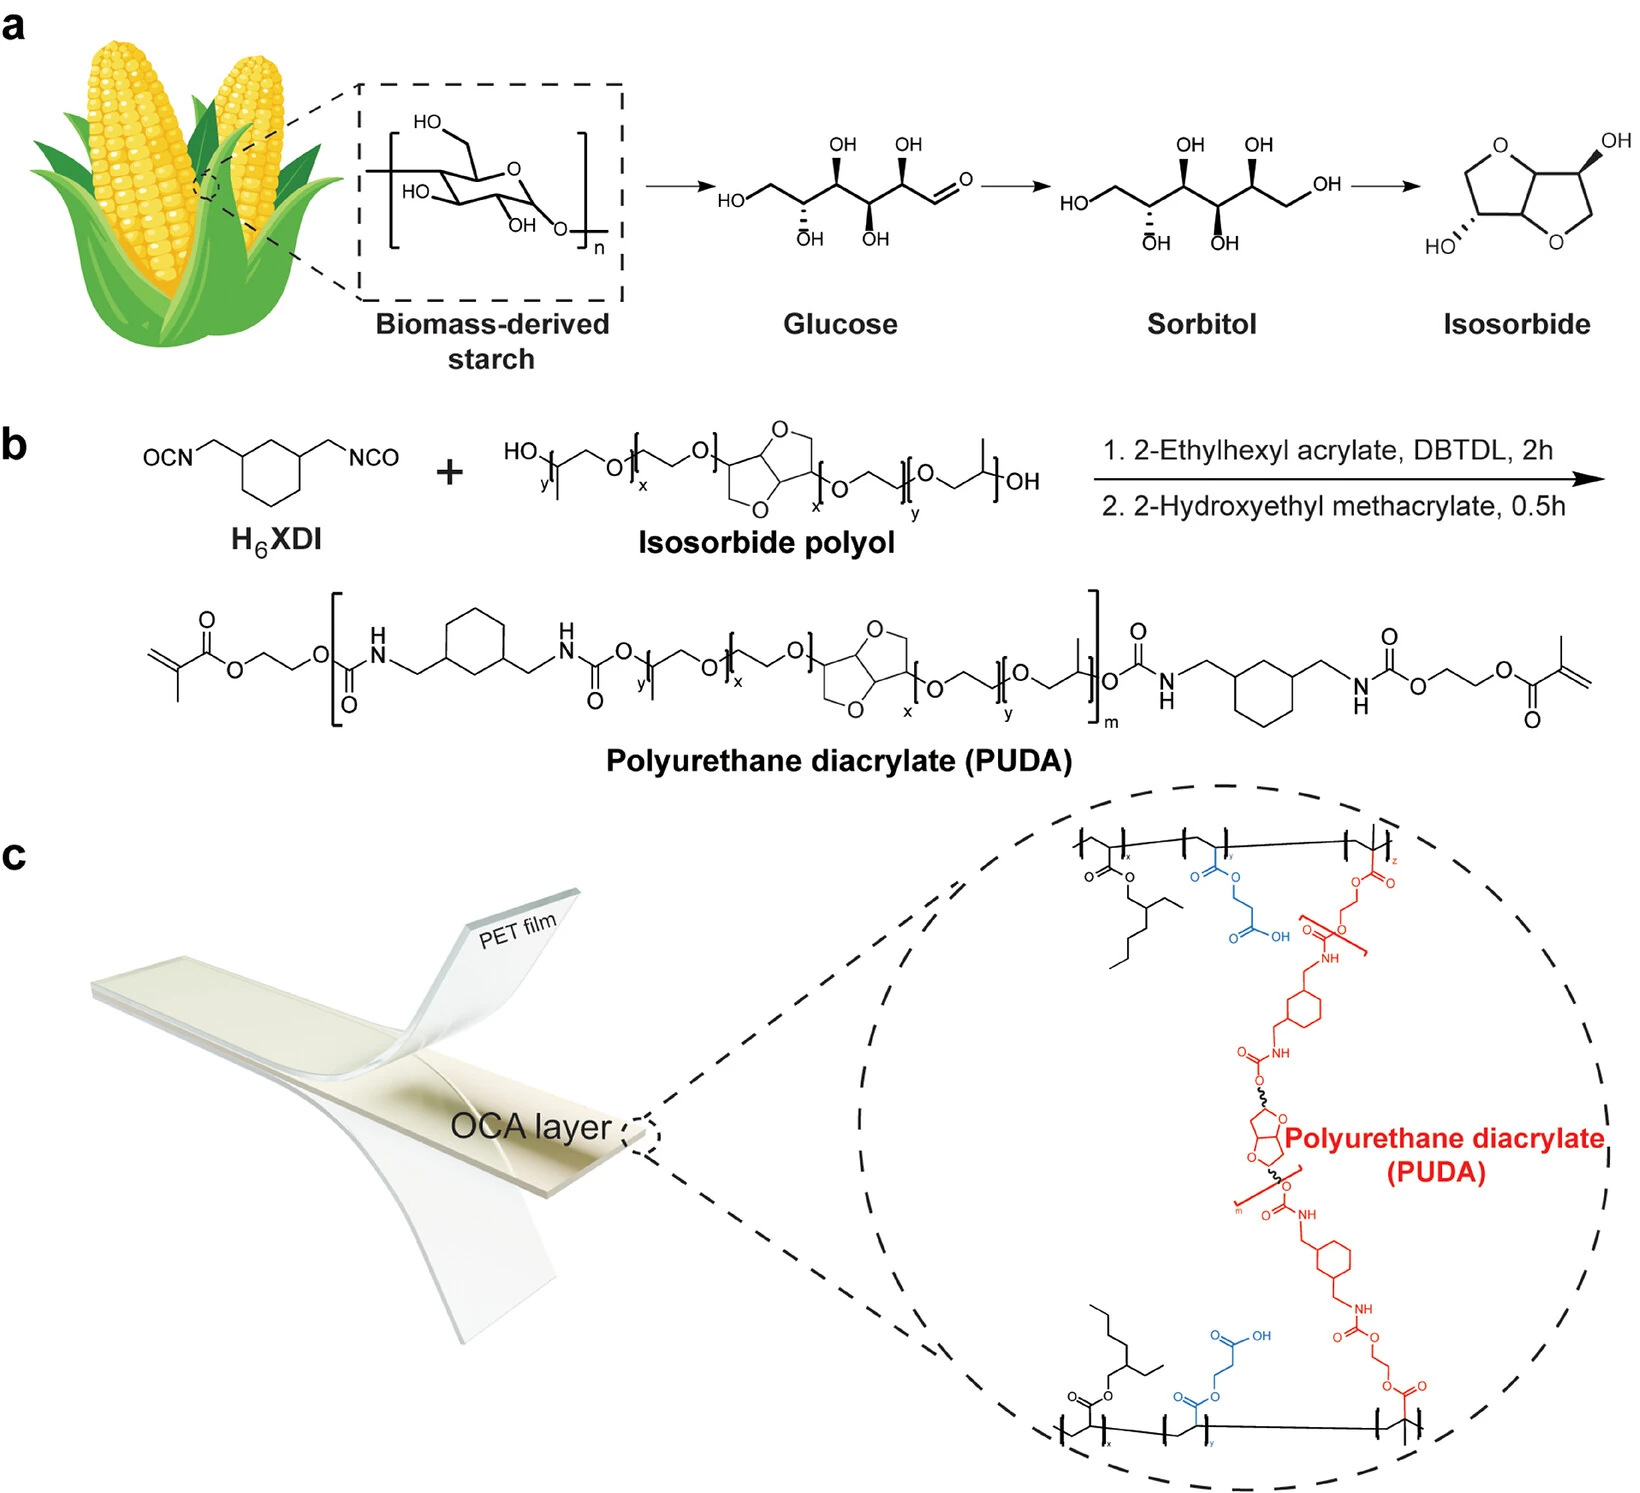
The key material is isosorbide, a biomass-derived dianhydrosugar alcohol obtained from glucose, with a rigid structure of two fused rings. To this the authors attached H6XDI (1,3-bis(isocyanatomethyl)cyclohexane) by urethane reaction and converted the ends to acrylate, making a polyurethane diacrylate (PUDA) crosslinker.
The control is HDDA (1,6-hexanediol diacrylate), in common use today. The comparison changed only the crosslinker within the same acrylic matrix.
Three things were aimed at in this design.
- Isosorbide has low birefringence. Since the layer sits between polarizers, this property becomes optical performance directly.
- The cyclohexane ring of H6XDI obstructs hydrogen bonding. It prevents the urethane groups from forming new hydrogen bonds and stiffening when stretched.
- The soft segments within the polyurethane chain keep the chains moving.
The third and the second are the grounds for the “returns quickly” property that comes later.
2. The arithmetic turning 6.8 percentage points of transmittance into 4% of battery
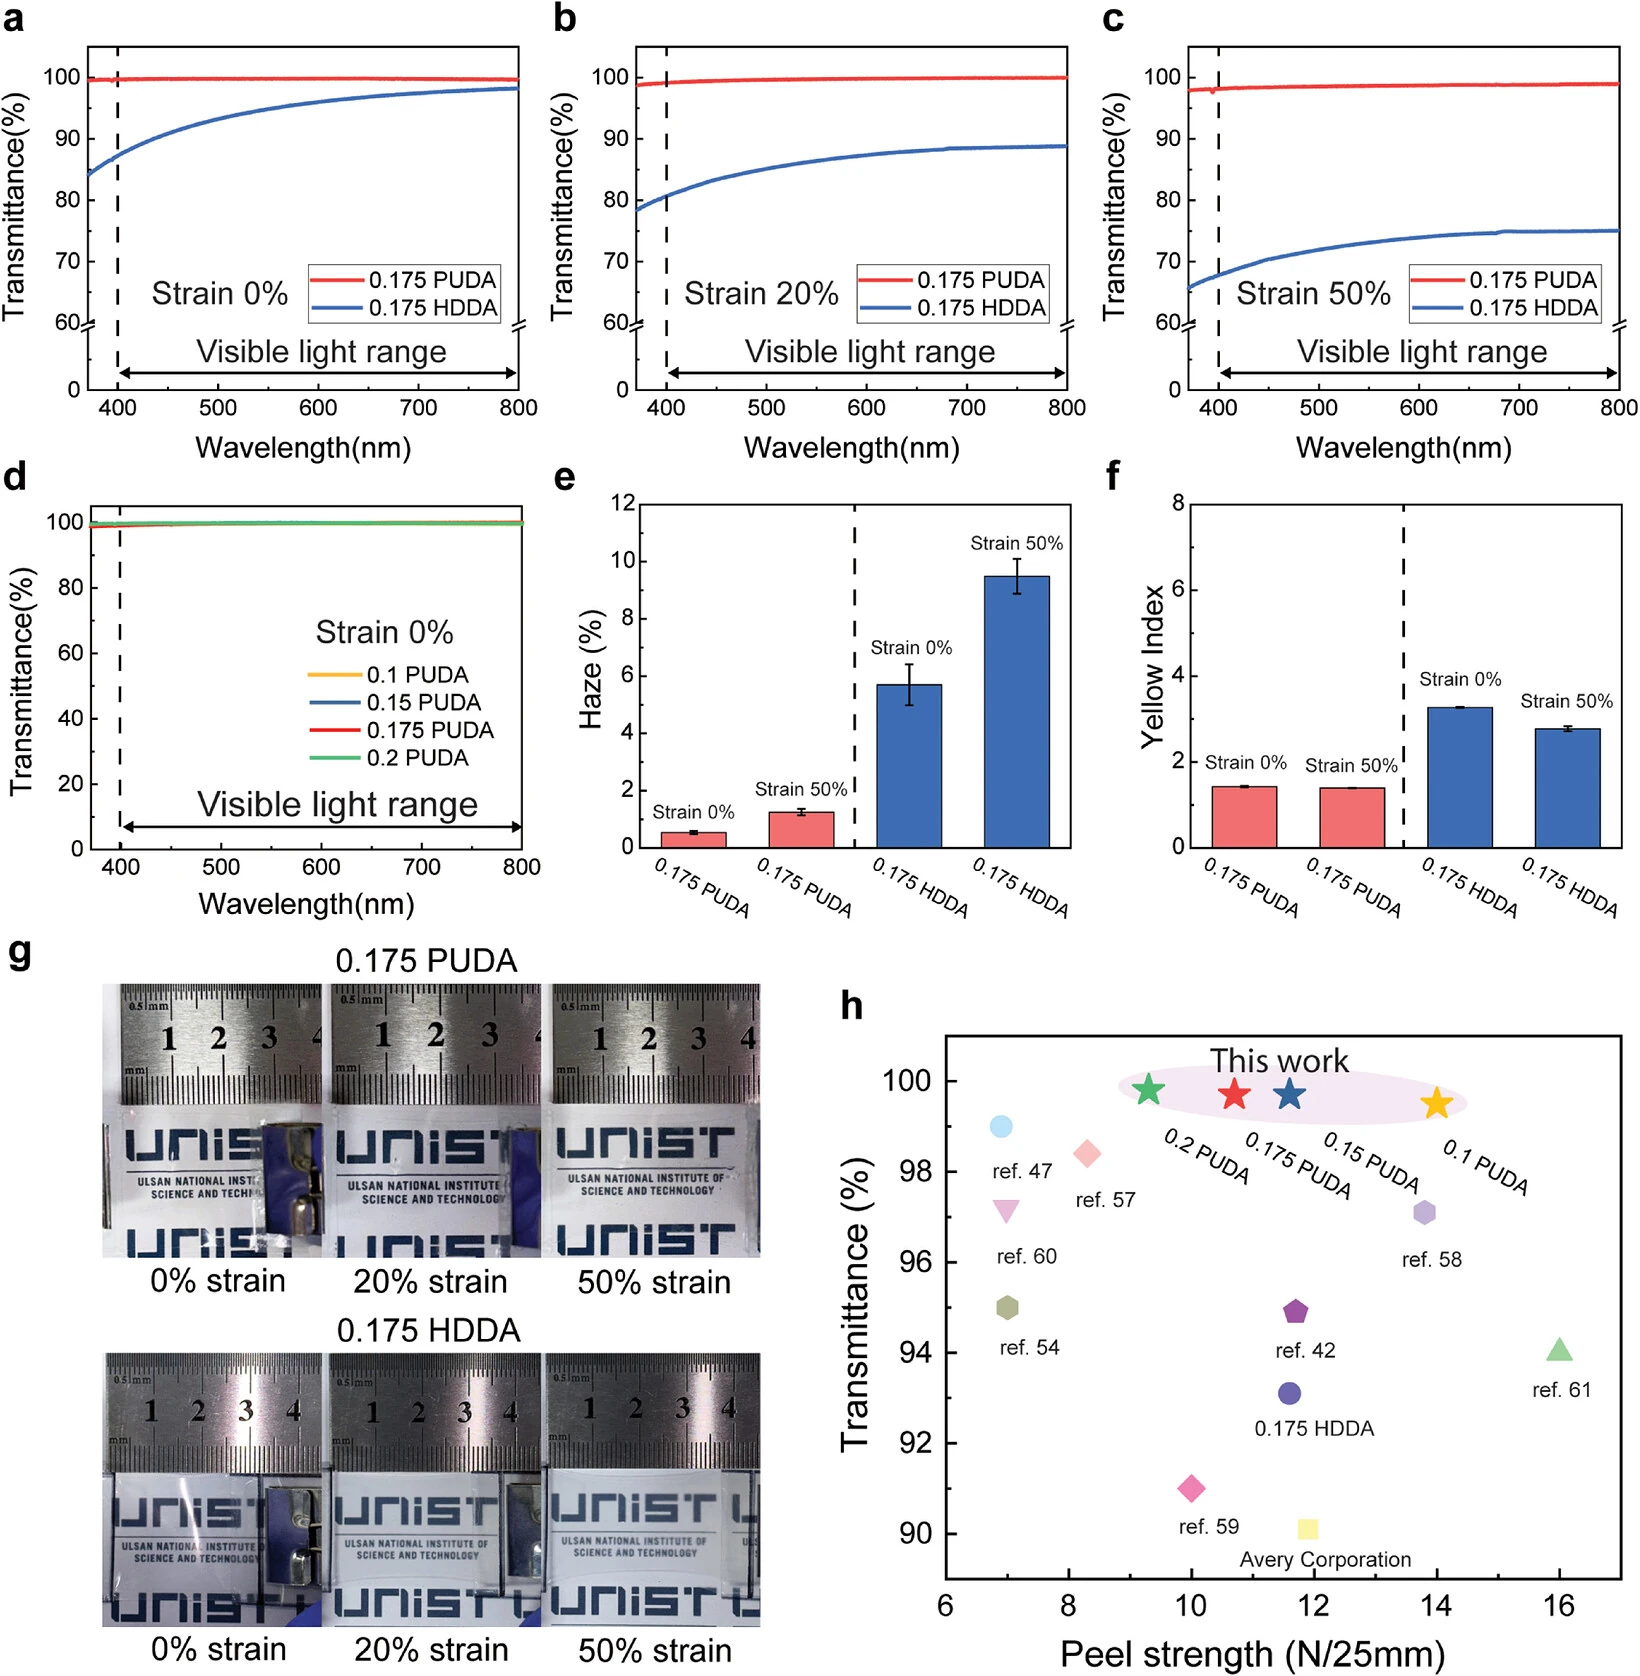
Start with transmittance in the unstretched state: the 0.175 PUDA formulation passed 99.8% across the whole visible range. The HDDA control is 93%.
A difference of 6.8 percentage points may not register, so the paper converted it into power. The logic is simple. The brightness a user sees is the panel’s brightness multiplied by the transmittance of the whole stack. Low transmittance means driving the panel that much harder for the same brightness, and OLED power consumption is proportional to panel luminance.
The paper’s calculation runs as follows.
| Item | Value |
|---|---|
| OLED power saving at the same external luminance | 7.31% |
| Share of total smartphone power taken by the display | about 50% |
| Whole-device power saving | about 3.66% |
| Increase in battery life | about 4% |
The 50% display share is an assumed value taken from other literature, so it is right to read this as a sense of magnitude rather than an exact prediction. The direction is clear all the same. Adhesive transmittance has been treated only as an image quality matter, when in fact it is a power item too.
3. Stretch it and it does not go hazy
More important is when it is stretched, because in a foldable the adhesive at the fold is deformed continuously.
The 0.175 PUDA held 99.6% at 20% strain and 98.6% at 50% strain, a drop of less than 1.2 percentage points from the start. Under the same conditions HDDA sank to 85.1% and 71.9%.
The difference is larger in haze, the measure of how much light scatters. PUDA merely rose from 0.54% to 1.25%, while HDDA went from 5.70% to 9.49%. In the photographs in (g) above, only the HDDA specimen visibly clouds as it is stretched.
Yellowness index (YI) is worth noting alongside. PUDA is effectively unchanged, 1.43 to 1.39, while HDDA is more than twice as high at 3.27 and 2.78. An adhesive that yellows makes a white screen look yellow.
Existing adhesives generally cloud on stretching because of partial crystallization, and the PUDA network did not show that phenomenon.
4. Released, it returns in 2.5 seconds
If an adhesive cannot return to its original length after stretching, that mark stays on the screen. It is one cause of the crease commonly spoken of in foldables.
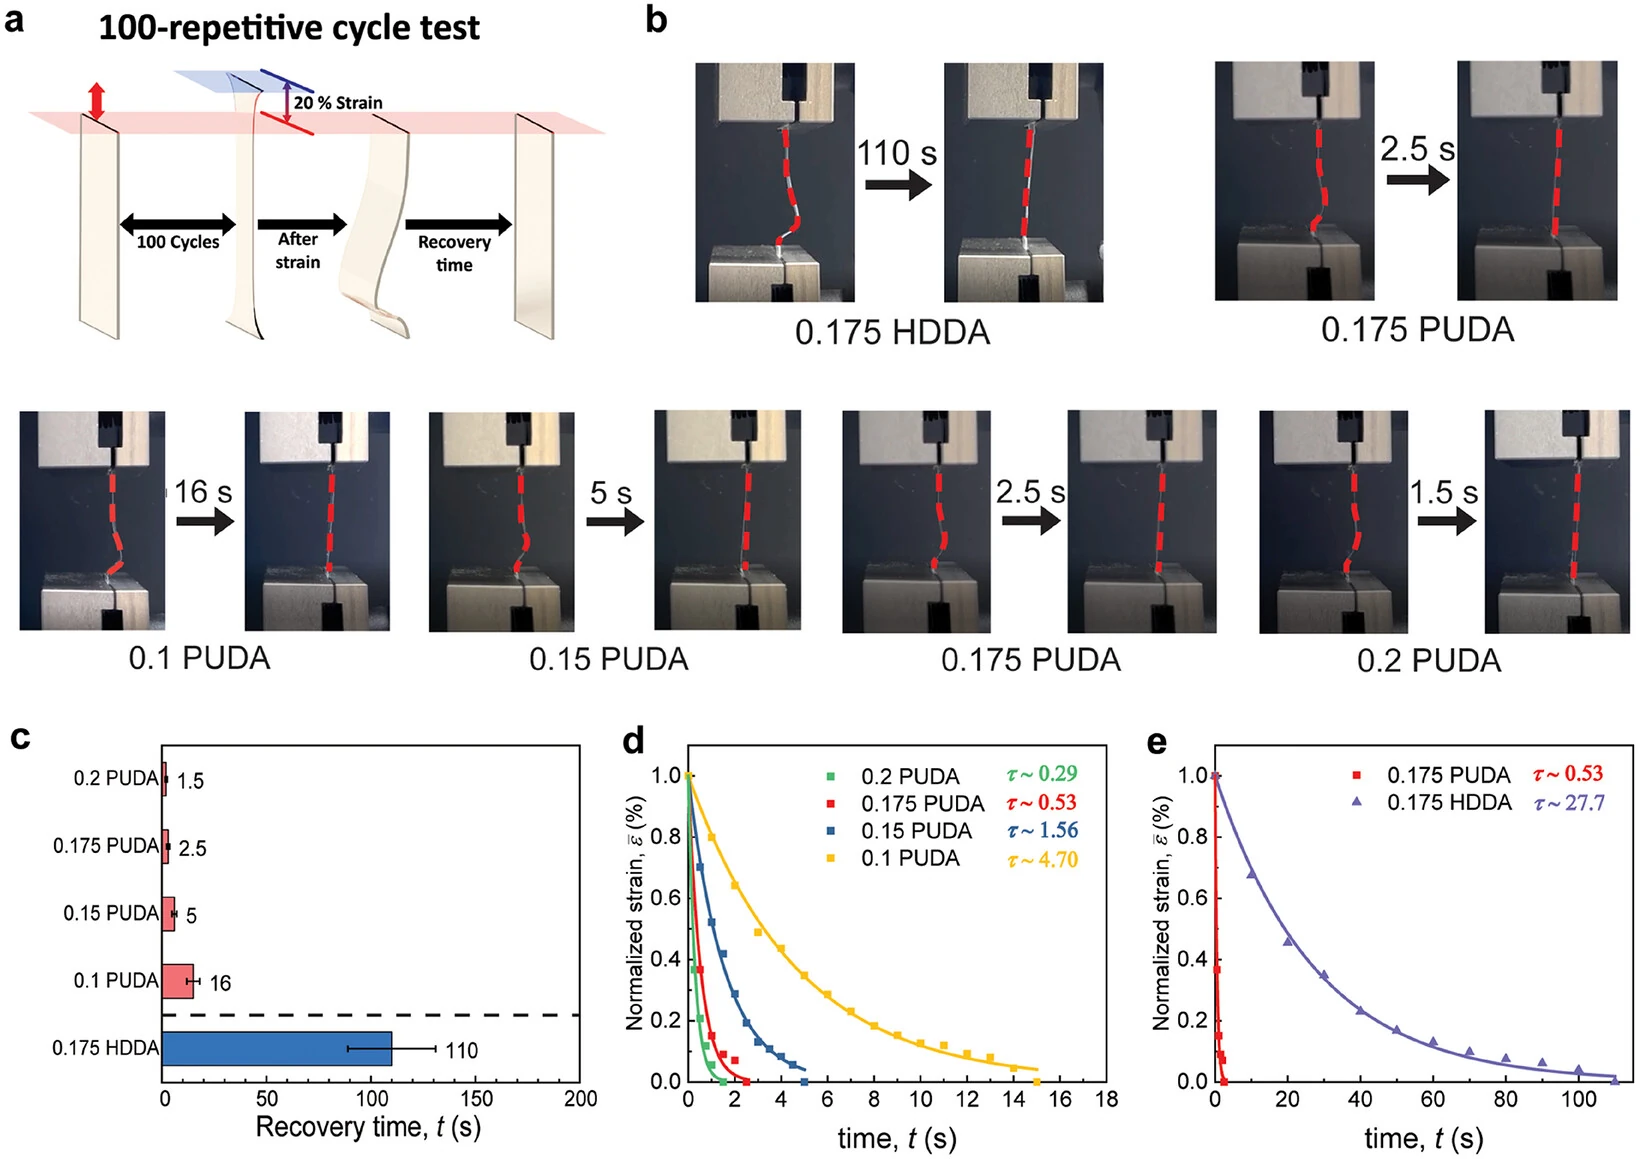
The time to recover fully after 100 cycles at 20% strain was measured.
| Crosslinker content | To full recovery |
|---|---|
| 0.1 mol% | 16 seconds |
| 0.15 mol% | 5 seconds |
| 0.175 mol% | 2.5 seconds |
| 0.2 mol% | 1.5 seconds |
| HDDA control | over 100 seconds |
The time constants from fitting the recovery curves with a single exponential decay model point the same way. The lowest crosslinker content, 0.1 mol%, gives 4.70 ± 0.07 seconds against 0.28 ± 0.02 seconds for 0.2 mol%, while the HDDA control is 27.68 ± 0.60 seconds. The coefficient of determination is around 0.99, a good fit, which means recovery is explained by a single relaxation mechanism rather than several tangled together.
The paper explains the difference by hydrogen bonding. During stretching, hydrogen bonds inside the adhesive break and re-form, and the newly formed bonds hold the chains, obstructing their return. PUDA uses the cyclohexane ring and a large molecular weight to push the chains apart so those new bonds do not readily form.
Energy lost under cyclic loading (hysteresis loss) also fell from 5.16 to 3.80 kJ/m³, and in a creep test pressing at 1,000 Pa for 300 seconds and releasing, the recovery ratio was 88.3%. HDDA gives 74.6%.
5. Why the fastest-returning formulation was not chosen
The table shows 0.2 mol% fastest at 1.5 seconds. And yet the authors chose 0.175.
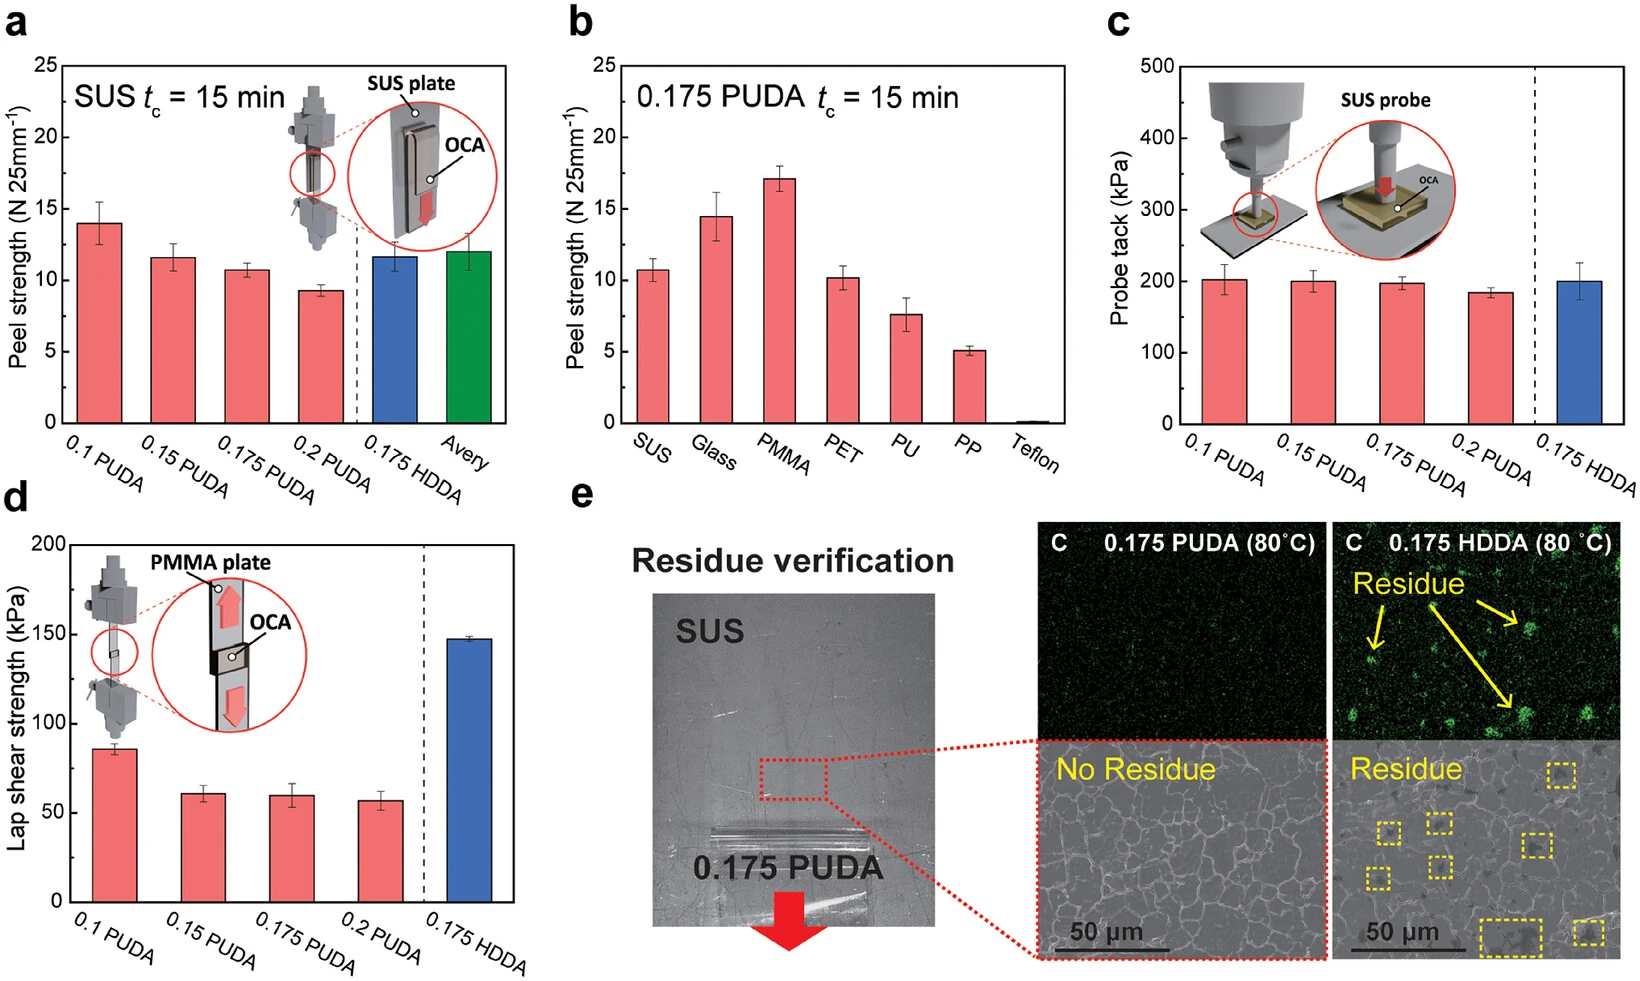
Because the sticking force comes down with it. Peel strength on stainless steel moves opposite to crosslinker content.
| Crosslinker content | Peel strength (N/25mm) |
|---|---|
| 0.1 mol% | 13.99 ± 1.48 |
| 0.15 mol% | 11.59 ± 0.95 |
| 0.175 mol% | 10.71 ± 0.50 |
| 0.2 mol% | 9.28 ± 0.39 |
| HDDA control | 11.65 ± 1.03 |
| commercial PSA (Avery) | 11.90 ± 1.30 |
The more crosslinker, the less the chains move and the poorer their ability to wet the substrate. 0.175 is the last point holding adhesion comparable to a commercial product.
It stuck broadly across substrates too, giving 17.11 ± 0.88 on PMMA, 14.45 ± 1.69 on glass and 10.18 ± 0.83 N/25mm on PET. After peeling at 80°C, the stainless steel surface checked by electron microscopy and elemental analysis showed no residue. That is the condition deciding whether rework is possible in assembly.
6. Winter, and 100,000 cycles
At room temperature and at 60°C the peel strength of the two adhesives is similar. Where they part is below zero.
At minus 20 degrees the 0.175 PUDA held 45.8 N/25mm while HDDA fell to 3.7 N/25mm, a factor of 12. Adhesion collapses at low temperature because the polymer network stiffens and can no longer wet the substrate surface properly, and PUDA has a low glass transition temperature with flexible chains, leaving room to move even below zero. Rheological measurement likewise showed a far smaller rise in storage modulus on cooling to minus 5 degrees on the PUDA side.
Opening and closing a foldable phone in winter is exactly this condition.
The durability test folded 100,000 times at a 2 mm radius of curvature, a condition in which the outer and inner faces of the adhesive at the fold take about ±2.5% tensile and compressive strain respectively. The deflection remaining after the test is as follows.
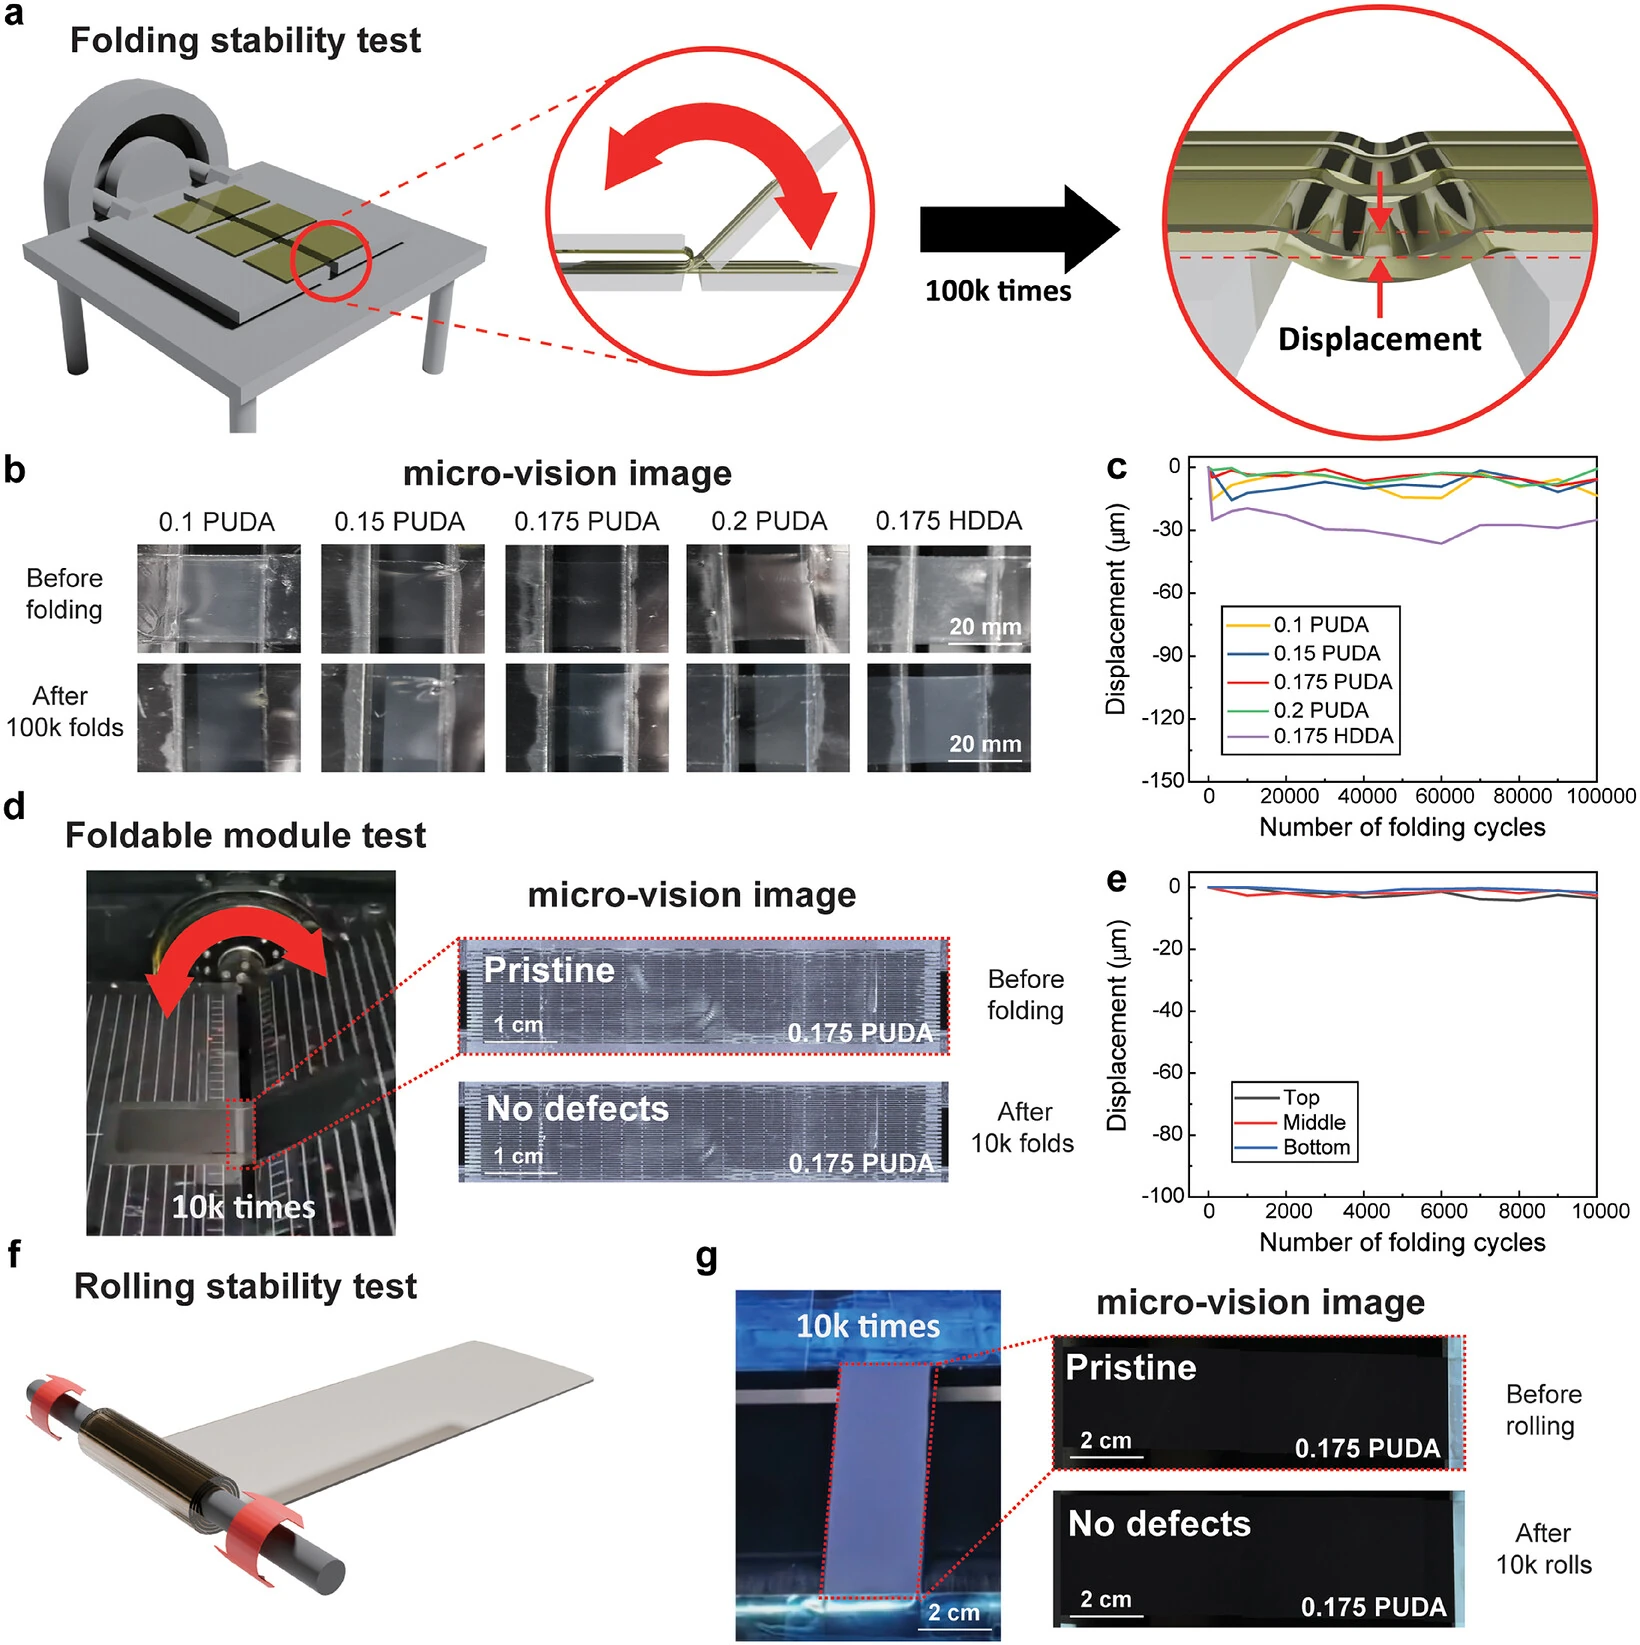
| Specimen | Deflection after 100,000 folds |
|---|---|
| PUDA 0.1 | −13.41 µm |
| PUDA 0.15 | −5.97 µm |
| PUDA 0.175 | −5.68 µm |
| PUDA 0.2 | −0.72 µm |
| HDDA control | −25.07 µm |
In a test folding a real foldable display module 10,000 times with 0.175 PUDA applied, −3.5, −2.6 and −1.6 µm remained at top, middle and bottom respectively, with no cracking, wrinkling or delamination observed. It also passed a rolling test of 10,000 cycles at a 20 mm radius of curvature.
7. A layer that is better the softer it is
Why the adhesive has to be soft is worth setting out as well.
A foldable stack folds layers of differing stiffness together. A stiff adhesive cannot absorb the deformation difference between layers, so stress piles into the stiff ones. Hence the field requires a storage modulus below 0.3 MPa, and to be a pressure-sensitive adhesive it must be below 0.1 MPa at 1 Hz (the Dahlquist criterion).
All the PUDA formulations came in under 0.1 MPa, and the adopted 0.175 formulation is 0.029 MPa.
That difference shows up as folding stress. The maximum bending stress the adhesive layer takes when folded is 2.00 to 3.23 kPa for the PUDA formulations, against 11.40 kPa for HDDA, four to five times higher. Since cracking and delamination under repeated folding begin where stress concentrates, a low value here is lifetime.
8. A paper written with a domestic materials company
What the industry should watch in this paper is in the author list. Two of the nine are with Youngwoo Co. (Gunpo, Gyeonggi), a domestic converter of adhesive and functional films. The measurement equipment was from domestic manufacturers as well, and the funding was the National Research Foundation of Korea’s basic research programme and its nano and materials technology development programme.
OCA has been a category dependent on overseas chemical companies’ products. That a domestic converter appears on the author list of research coming out of that position is itself part of this paper.
What this paper covers, though, is the properties of the adhesive film alone. In a real module, interfacial reliability when laminated with cover window, polarizer and panel, high-temperature high-humidity testing, long-term yellowing and large-area coating uniformity remain as separate gates. The 10,000-cycle test on a foldable module is a first confirmation in that direction; the 100,000-cycle test is still a film-only condition.
Even so, taking the adhesive out of the position that “an adhesive just has to stick” is this work’s value. Transmittance becomes power, recovery speed becomes the crease, and low-temperature adhesion becomes winter reliability. The thinnest layer in a foldable stack in fact holds three specifications at once.
- optically clear adhesive (OCA)
- An adhesive film that bonds the layers of a display while passing light through unchanged. Usually tens of micrometres thick.
- isosorbide
- A biomass-derived dianhydrosugar alcohol obtained from glucose. A rigid structure of two fused rings, with low birefringence.
- haze
- The fraction of transmitted light that scatters. A large value makes the screen look cloudy.
- Dahlquist criterion
- The empirical criterion that storage modulus at 1 Hz must be below 0.1 MPa for a material to work as a pressure-sensitive adhesive bonded by hand pressure.
- creep recovery ratio
- The proportion returning to the original shape after a sustained force is removed. What remains is permanent deformation.